Beyond Buffers: Can You Have Your Cake and Eat It Too?

Man Group

Research

14 Pages

Man Group examines whether buffer ETFs’ downside protection is worth the long-term cost of capped upside. Since 2005, its buffer proxy lagged equities by 2% annually despite a smaller drawdown, while a hypothetical equity-plus-trend portfolio outperformed equities by nearly 2% annually with reduced drawdowns.

Key Takeaways

Buffers reduce drawdowns: Buffer Index lagged equities by 2% annually, but maximum drawdown improved to -44% versus -56%.
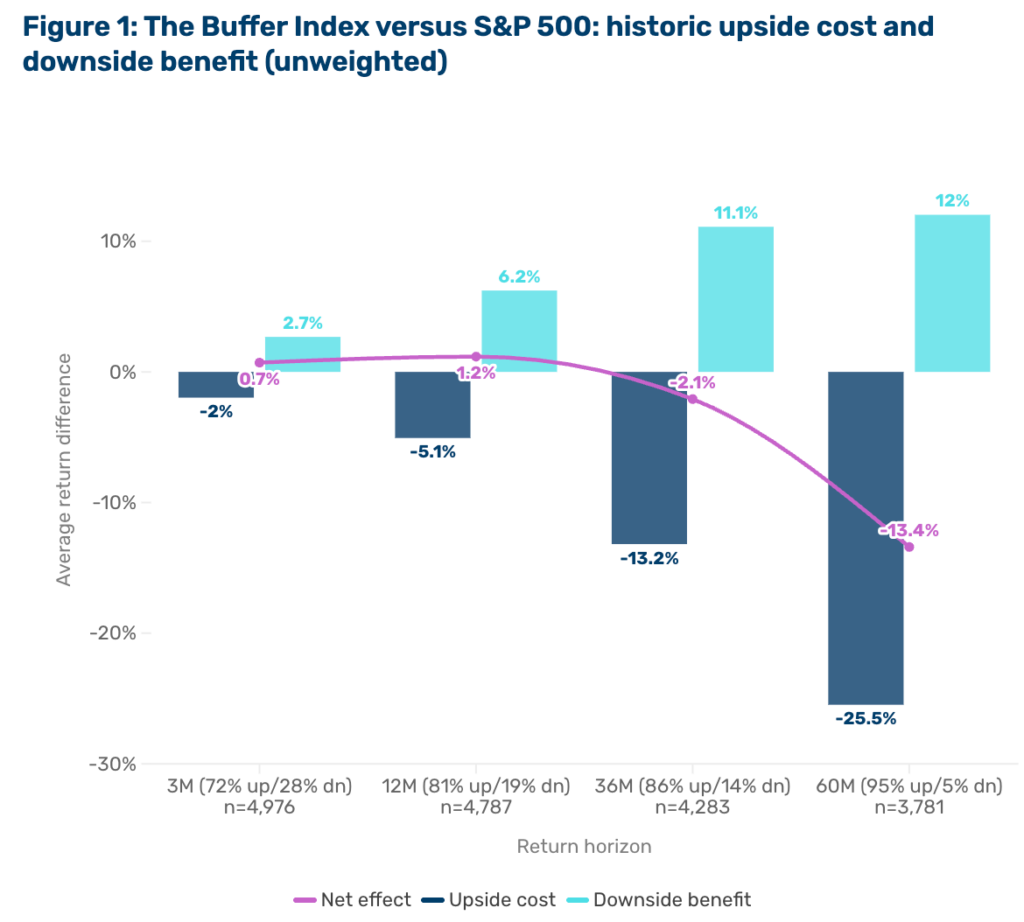
Upside dominates: Over rolling three-month periods, equities rose nearly 75% of the time; buffers cost 2.0% in up markets versus 2.7% downside benefit.
Trend changes tradeoff: Portable alpha outperformed equities by nearly 2% annually while reducing maximum drawdown to -49% versus -56% for equities.
Source: Bloomberg and Cboe. Date range: December 2005 to February 2026. Past performance is not indicative of future results.

Join our newsletter to have all of this content + Exclusive Newsletter Bonus Content delivered to your inbox every week

Related Content

Portfolio Management
Oct 2026
Asset Allocation
Oct 2026
Scroll to Top